
I now have two retirement planning spreadsheets for couples, and a few people have asked which one they should use. The honest answer is that it depends on where you are on the journey. My partner and I use both, so here’s a quick guide to what each one does and when you might reach for it.

The Couples Retirement Planning Spreadsheet
The original spreadsheet has been around since 2020. You tell it how much you plan to spend, and it tells you how long your money will last.
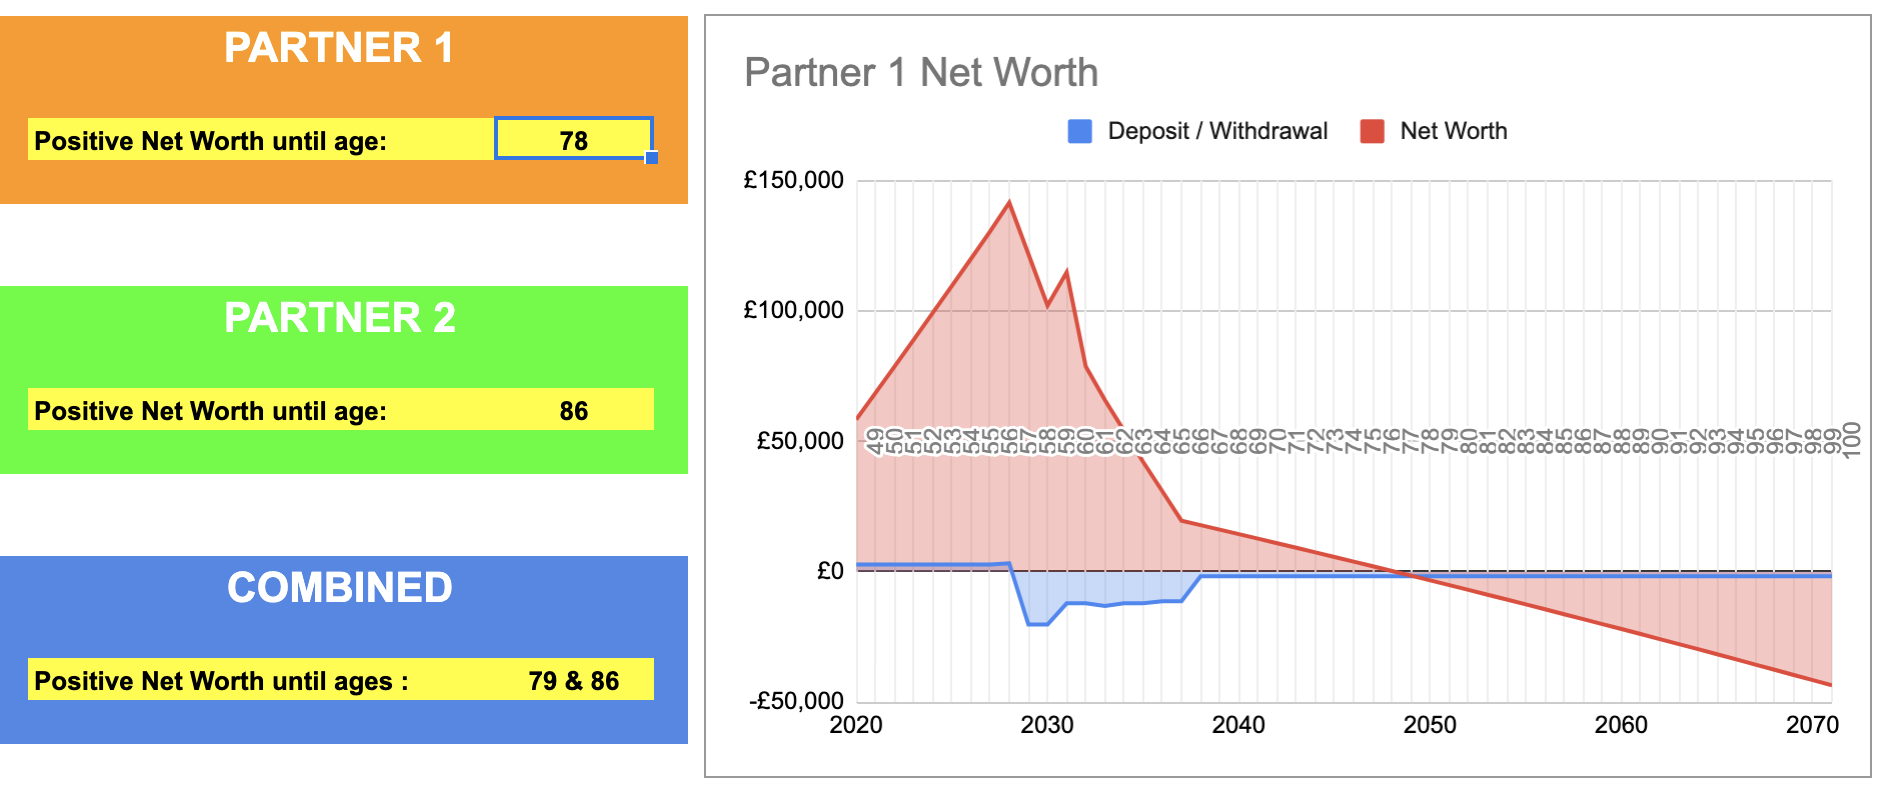
It tracks every pot individually: cash savings, ISAs, investments, up to five pension pots each, final salary schemes and the state pension. It includes a detailed monthly budget, a mortgage and even those annual splurges. Everything is expressed in today’s money using an “effective rate” (your assumed return minus inflation). The big number at the end is the age at which your net worth dips below zero, if it ever does.
The Couples Bridging Calculator
The Bridging Calculator is new this year and turns the question around. It tells you how much you can safely spend each year without running out.
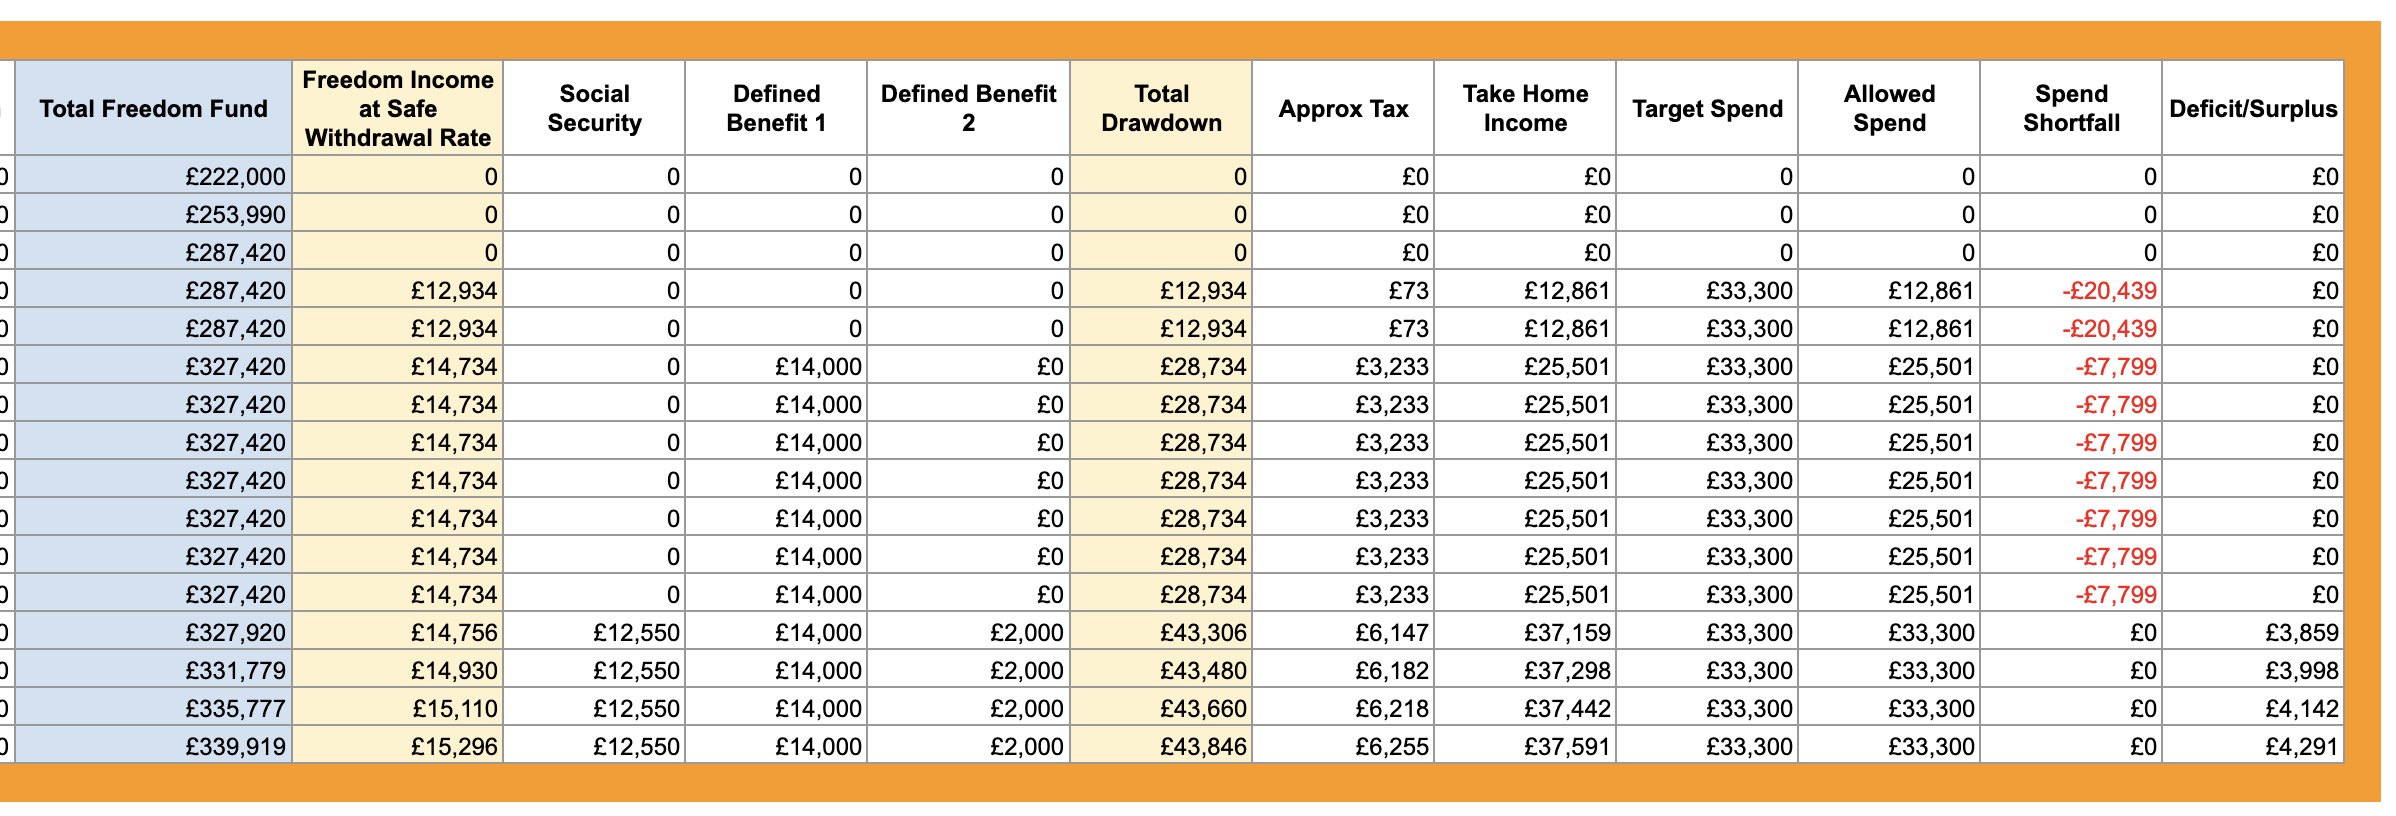
It’s built on the 4% rule, which I learned about through the brilliant (and free) Rebel Finance School. You lump your invested money into a single Freedom Fund, choose a burn rate of 4, 4.5 or 5%, and the calculator shows year by year how that withdrawal, plus any defined benefit and state pensions, covers your target spend. The tricky part is the gap between stopping work and your guaranteed pensions starting, which is where the name comes from.
The Key Differences
| Original Planner | Bridging Calculator | |
|---|---|---|
| The question | How long will our money last? | How much can we safely spend? |
| Your spending | Fixed input | Capped by a safe withdrawal rate (optional) |
| Your pot | Can be spent down to zero | Designed to be preserved |
| Market risk | Handled by choosing a cautious growth rate | Handled by a cautious withdrawal rate |
| What’s counted | Everything, including cash | Invested money only (no cash) |
| Tax | A budget line you fill in | Estimated for you (worst case) |
| Detail | Pot by pot, month by month | Summary figures, year by year |
The biggest philosophical difference is what happens to your capital. The original is happy for you to spend your last penny at 100. The Bridging Calculator aims to leave your Freedom Fund intact, and asks you to trim your discretionary spending in a bad year rather than dip into it.
Which One Should You Use?
Use the original planner if:
- You’re still some way off retirement and want to see whether you’re on track
- You want to model lots of individual pots with different growth rates
- You want to test “what if” scenarios such as retiring five years earlier or spending £200 more a month
- You’re comfortable spending your capital down over your lifetime
Use the Bridging Calculator if:
- You’re within a few years of retiring and need to know whether you can actually stop
- You plan to retire before your defined benefit or state pensions start
- Most of your savings are in stocks and shares rather than cash
- You’d rather adjust your spending than risk depleting your pot
Use both if: you’re somewhere in between, like us. I keep all the detail in the original planner (every pot, pension and budget line) and use those figures to fill in the handful of inputs the Bridging Calculator needs. The original tells us we’ll be OK in the long run. The bridge tells us whether we can afford to stop work now.
One Word of Caution
Neither spreadsheet knows when you’re allowed to touch your private pensions. SIPPs and workplace DC pensions can’t normally be accessed until 55 (rising to 57 from 2028). If you’re planning a very early retirement, make sure you have enough in ISAs and other accessible pots to get you there.
Happy planning. Let me know which one works for you!
This article is for informational purposes only, it should not be considered Financial or Legal Advice. Not all information will be accurate. Consult a financial professional before making any major financial decisions.
Comments